Help us change the law to make cycling safer in California!

There’s a new petition out to amend the California Vehicle Code to allow motorists to cross a double yellow center line to pass a bicyclist when safe to do so. Please sign the petition and help spread the word!

Visit matthewschange.org for more information.

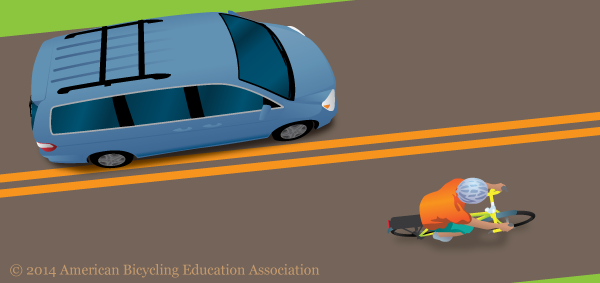
By Greg Kline

Although the recent implementation of California’s 3 Feet for Safety Act has clearly informed motorists of the need to leave sufficient space when passing cyclists, it still does not fully address the needs of cyclists nor of motorists when it comes to narrow two-lane roads with long sections of double-yellow lines. Currently it is not legal for faster motorists to pass slower cyclists over a double yellow line, even when safe to do so. Drivers of motor vehicles are now forced to make the decision to either endanger a cyclist’s life and break the law (CVC 21760 three feet for safety act) by passing too closely or break another law (CVC 21460 double lines) by crossing a double yellow to pass safely.

The majority of roads in California, and almost all two-lane roads have lanes that are too narrow for cyclists to safely share with motor vehicles. Here’s why:

A bicycle is a two wheeled articulated vehicle that remains upright by balance.  A cyclist is approximately 2′ wide, and requires at minimum 12″ on either side for balance and minor obstacle avoidance. Assume a 4′ minimum operating space for a bicyclist, the operating width used by the AASHTO design manual and the guidelines set forth by the Federal Highway Administration.

If you add the 4′ operating space for a cyclist to the 3′ required for minimum legal safe passing clearance and 8.5′ (*excluding* mirrors) maximum vehicle width in California you come up with 15.5′. Most lanes in California are 10 to 12 feet wide and require moving into the next lane to safely pass a cyclist safely.

14' lane is too narrow to share
Graphic by Keri Caffrey iamtraffic.org


Most rural roads have lanes much narrower than 15.5′ and many miles of double yellow. It is unreasonable to assume that motor vehicle traffic will slow to the speed of cyclists until there is either a passing lane or a turnout. Faster vehicles will either pass unsafely and illegally (too closely) or just illegally (by crossing, at least partially, a double yellow).

Yet a previous version of California’s three foot law was specifically vetoed by Governor Brown for allowing for such passes when safe to do so:

California Senate Bill 1464

(f) The driver of a motor vehicle on a two-lane highway may drive to the left of either of the markings specified in subdivision (a) or (c) to pass a person operating a bicycle proceeding in the same direction if in compliance with Section 21751 and if both of the following conditions are met:

(1) The left side of the road is clearly visible and free of oncoming traffic for a sufficient distance ahead to permit overtaking and passing of the bicycle to be completely made without interfering with the safe operation of any vehicle approaching from the opposite direction.

(2) The driver operates the motor vehicle to the left of either of the markings specified in subdivision (a) or (c) only to the extent reasonably necessary to comply with Section 21750.1.

Governor Brown’s reasoning in his veto of Senate Bill 1464 in September of 2012:

“Crossing a double yellow line is an inherently dangerous act that increases the risk of head-on collisions. When a collision occurs, it will result in a lawsuit where the state is likely to be sued as a “deep pocket.” By making it legal to cross a double yellow line, the bill weakens the state’s defense to these lawsuits.”

By vetoing SB 1464, and subsequently passing the watered down version that became law, Governor Brown prioritized the safety, speed and convenience of motorists, protected by airbags and crumple zones, over the lives and safety of cyclists who have no protections.

Governor Brown’s veto of SB 1464 and passage of Assembly Bill No. 1371 was a decision to not afford cyclists the same protections that other road users enjoy. As such, it does not shield the state from “deep pocket” lawsuits from cyclists. That may be what is required to amend the law to give cyclists the protection the 3′ law was intended to confer.

Many states have sensible laws that allow motorists to cross double yellows when passing a slow moving vehicle such as a cyclist or slow moving farm equipment. For example, here is Ohio’s statute.

§4511.31.  Hazardous zones

(A) The department of transportation may determine those portions of any state highway where overtaking and passing other traffic or driving to the left of the center or center line of the roadway would be especially hazardous and may, by appropriate signs or markings on the highway, indicate the beginning and end of such zones. …

(B) Division (A) of this section does not apply when all of the following apply:

   (1) The slower vehicle is proceeding at less than half the speed of the speed limit applicable to that location.

   (2) The faster vehicle is capable of overtaking and passing the slower vehicle without exceeding the speed limit.

   (3) There is sufficient clear sight distance to the left of the center or center line of the roadway to meet the overtaking and passing provisions of section 4511.29 of the Revised Code, considering the speed of the slower vehicle.

Comment:  Section 4511.31(B) should help reduce tension between cyclists and faster drivers.  Now, they can pass in “no passing” zones IF passing is safe.

By allowing faster traffic to pass slower cyclists when safe to do so, drivers of motor vehicles would not be forced to make the decision they now need to make in California: either endanger a cyclist’s life and break a law, or merely break a different law. The choice, obvious as it is, isn’t as clear as it needs to be. The three foot law needs to be amended to meet the needs of all road users.

crossing_double_yellow

A Slice of Huntington Beach

As Newport’s neighbor to the north, Huntington Beach shares the “road of dreams”, better known locally as PCH or Coast Highway, or formally known as The Pacific Coast Trail.

Garden Grove edged out Huntington Beach in a tie with Newport Beach for “bronze” or third place in the most dangerous cities to ride a bike in the county leaving HB to “improve” to 4th place.

10 bike riders were killed with 1,055 injured since 2001.

The deadly streets of Huntington Beach:

HB Deadly StreetsRT 1, or PCH and Brookhurst are two roads where half of fatal rider collisions occurred.

The most current Huntington Beach records are from 7/28/12 which shows at least some county records are making it to the CHP.

Abbreviations used:

FTS = Failed to Stop, FTY = Failed to Yield, FTR = Far to the Right

And now for the pie charts!

HB Dead

According to the assigned fault as shown, bike riders were responsible for their own death 49% of the time although 20% of the fatality’s fault was undetermined so it could range as high as 69% .

Rider faults seem evenly split until you notice that 2 are due to BUI or Bicycling Under the Influence, with another DUI/BUI listed in the “unknown” category making 3 riders dead thanks to the impairment of some intoxicant.

Drivers in  Huntington Beach failed to stop, signal, or drive on the right side of the road resulting in another 3 riders dead.

HB Injured

Riders were responsible for just under 75% of their injuries by colliding with other vehicles.

Just like in Santa Ana and Garden Grove, riding on the wrong side of the road, or not far enough to the right to suit the citing officer is the predominant cause of collisions. Given the tourist factor and beach-side flavor it is more likely that wrong way riders aware of the proper rules of the road, choose to ignore them to make their way about HB.  Better signage and road treatments like sharrows could help direct riders to “go with the flow”.  Selective enforcement actions also would help reduce rider collisions perhaps by issuing warnings, then citations for repeat (observed) offenders.

Certainly an educational outreach is needed and in fact, rumor has it that a class is scheduled this coming November 15th with the on-road portion on the 17th at the Rodgers Senior Center. We could not confirm the class schedule or registration because it’s not listed on the calendar as yet, and at press time the online registration system was out of service.  Should things get back to normal, online registration will be available at www.hbsands.org. Check the City’s calendar for updates, or see the class announcement here.

When is it safe to ride?

The following chart is a compilation of injuries as they occurred in 3 hour segments over the course of a year.

HB Collision Time

One third of collisions occur between 6 a.m. and noon, with 50% happening from noon till 6 p.m.  which might indicate too much sun and suds for clear riding judgement. 17% of collisions happen from 6 p.m. to midnight, while the hours from midnight to 6 a.m. account for the rest at less than 3%.

Types of Collisions:

Shown here are the types of collisions for Huntington Beach:

HB Collisions

With almost half of injury collisions occurring due to riders riding “against the flow”, we see an almost perfect correlation to the expected outcome with 53% of riders being broadsided.  Again, it would be wrong to to notice broadside collisions, with a predominate wrong way riding to infer that riders are getting broadsided because they aren’t where they’re expected to be, as drivers aren’t looking for traffic coming from the right. That would be just wrong so we won’t do it.

Huntington Beach has a tough challenge to make the streets safer for everyone, from the busy tourist beach scene, to the bustling inner streets of the city. We’re encouraged that they are almost midway through the development of a draft City Bike Plan, however much can be done before the plan is complete to mitigate behavioral causes for collisions as noted above.

We welcome working with city and county staff and other agencies to develop an effective outreach program to better meet the safety needs of all bike riders in the city.

A Slice of Garden Grove

Garden Grove edged out Huntington Beach in a tie with Newport Beach for “bronze” or third place in the most dangerous cities to ride a bike in the County.

11 bike riders were killed with 583 injured since 2001.

The deadly streets of Garden Grove:

GG Deadly StreetsNo street  stands out as having a majority of collisions except Brookhurst and Garden Grove Blvd with 2 and 3 fatalities respectively across their length.

The most current Garden Grove records are from 12/29/11 which is laughable considering the current date of 10/25/12.

On the other hand, maybe there was nothing to report!

As much as we may wish that no collisions occurred between then and now, somehow we just know that the reality will sadly prove otherwise. It would be interesting to know the reason why and if someone want to leave an anonymous tip to the editor we’ll start a discreet investigation.

Abbreviations used:

FTS = Failed to Stop, FTY = Failed to Yield, FTR = Far to the Right

And now for the pie charts!

 GG Dead

According to the assigned fault as shown, bike riders were responsible for their own death 55% of the time. The major rider fault is riding on the wrong side of the road. For the second time, Bicycling Under the Influence makes an appearance accounting for 18% of the fatalities, although the technical nuance between a citation for 23152 and 21200 are too fine for this writer’s eyes to discern. With almost one third, or 27% of collisions in the “unknown / not stated” category, even though 1/3 of those were attributed to speeding by at least one of the parties in the fatal collision, perhaps being able to figure out who was at fault for the collision is trickier in Garden Grove than in other cities.

Since 27% could swing either way, it’s feasible that bike riders could be 82% at fault which is terrible, but better than Santa Ana’s 92%. Drivers in Garden Grove failing to stop or failing to yield contributed the remaining 18 or 45% depending on the final assignment of fault.

GG Injured

Riders again were responsible for over 75% of their injuries by colliding with other vehicles.

Just like in Santa Ana, riding on the wrong side of the road is the predominant cause of collisions. Given the demographic makeup of Garden Grove, could cultural traditions or mores also be in play for this behavior? Perhaps better enforcement of the rules of the road to violators is in order.

Certainly an educational outreach is needed and we look forward to partnering with agencies to work with to improve the understanding of the rules of the road.

According to the CHP population index, Garden Grove could have more than twice the population of Newport Beach, so maybe it’s commendable that despite the greater number of people in the city, fatalities are on par with a city half its size (at this point in time),  while bike riders injured in Garden Grove are less than Newport Beach at 583 and 740 riders injured respectively.

So how can the 2 cities be tied for 3rd in a race given their population differences and injury counts? The simple answer is the kill count – both are the same, and without an obfuscating rosy board of tourism or chamber of commerce statistical sleight of hand, this absolute number is the final arbiter at this time.

Yes it is possible to have parallel rankings for death and injury, and it is possible to add death and injury totals to create an index to rank the cities, however, indexing by absolute numbers of riders killed and providing the resultant data on injuries as a byproduct speeds our delivery of actionable material to get the death count down across the county.

When is it safe to ride?

The following chart is a compilation of injuries as they occurred in 3 hour segments over the course of a year.

GG Collision Time

One quarter of collisions occur between 3 and 6 p.m. but the hours before 3 and after 6 indicate a 19% rise and a 18% fall from the 25% peak. The morning commute is easily spotted with 16% of collisions happening from 6-9 a.m.

Two thirds of collisions occur in the 12 hours from noon to midnight,  which also might indicate bike riders not being visible to others on the road, and it is close to Santa Ana’s 72%. Is there a cross commute going on here?

Types of Collisions:

Shown here are the types of collisions for Garden Grove:

GG Collisions

Again, it would be wrong to to notice broadside collisions, with a predominate wrong way riding with the majority of collisions happening from noon to midnight by infering that riders are getting broadsided because they can’t be seen and drivers aren’t looking for traffic coming from the right. That would be just wrong so we won’t do it.

Garden Grove has a tough challenge to make the streets safer for everyone, and if they could get their data records in to Sacramento in a timely fashion, we would know sooner whether actions taken have had their desired effect, and if not, what course of action is best suited for the problem at hand.

While we can’t help move their data faster, we do welcome working with city and county staff and other agencies to develop an effective outreach program to better meet the safety needs of all bike riders in the city.

A Slice of Anaheim

Keeping our tradition of “slicing the Orange”, we present the latest statistics for Anaheim.

Anaheim is the 2nd worst city for bike collision fatality and injury in the county.

With 13 dead and 1,048 injured since 2001, we sought to unravel a common denominator.

Anaheim Deadliest Streets

Anaheim Deadliest Streets

Here are the roads where bike riders were killed:

Even the happiest place on earth is not immune to deadly collisions as seen by the fatality created by a speeding motorist at Ball and Cast Place in Disneyland last year.

The latest records from Anaheim are from 2/24/12.

Abbreviations used:

FTS = Failed to Stop, FTY = Failed to Yield, FTR = Far to the Right

And now for the pie charts!

Anaheim Killed by Fault

Once again, bike riders are their own worst enemy according to the authorities. Failing to stop, riding on the wrong side of the road, and failing to yield are 3 simple things these riders should have done and had they done so, there would be more bikes on the road today. After all, how often do you hear someone saying, “I wish there were more cars on the road!

Motorists were also guilty of carelessness resulting in an additional needless loss of life by speeding, and generally failing to maintain or exercise proper control of their vehicles.

Bike riders in Anaheim must really like pain because according to the data, they are responsible for over 80% of collisions with motorists. Now I have yet to meet one cyclist who actively looks to get into a collision with a car, truck, or tank, so I would treat these numbers with some suspicion.

Anaheim Injured

If perception is reality, then this reality needs to change and quick. With the 2nd highest death count and 2nd highest injury count, the cycling population of Anaheim is doomed to quick extinction if they keep this up. The causes presented by the data are mostly behavioral, so here’s a refresher:

  • Ride with the direction of traffic
  • Stop at and signs and signals
  • Be Polite, wave as you yield the right of way (a smile always helps)
  • Signal your intentions, let people know what you plan to do
  • Use front and rear lights and reflective clothing to be seen better

Five simple things that you can count on one hand. Master these and watch Anaheim switch sides from one of the worst, to one of the best cities to ride in. It all starts with you.

Yes, there are infrastructure issues as well. For this reason, roadway treatments in one city need to be coordinated with the the adjacent city, and so on. In fact, we looked at all the roadways involved in collisions and found that 20% of all collisions happened on 5 roads. Certainly some room for improvement there, can you guess which roads / streets they are?

An active and engaged Bicycle Action Committee is needed for this city – stat.

Who is willing to rise to the call?

Let us know who you are and we’ll help guide the process transforming Anaheim into a cycle-safe place to ride.

Thanks for your support.