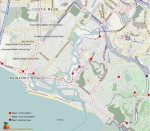
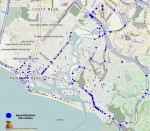
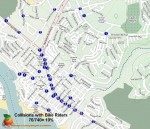
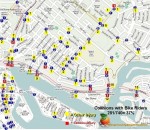
This page shows the locations of collisions as recorded by the CHP Statewide database between people on bikes and everyone else. Motor vehicles, motorcycles, pedestrians, and even other bike riders are included in their database and these maps.
The data reflects collisions from 2001 to the present end of quarter 3, 2012 , and is updated quarterly.
The CHP has a severe time delay in processing records on the order of +7 months, however it’s the best we have at this time.
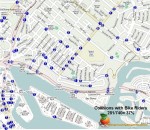
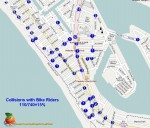
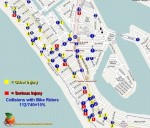
While the above maps show locations and counts, we thought it might be worthwhile to look at the degree of injury sustained from a collision at a particular location. The peninsula is partial due to the ability to make it fit in a readable form.
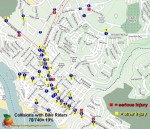
There are 3 degrees of injury: complaint of pain, other visible injury, and severe. The following maps have two degrees of injury overlaid on the collision maps from above. In the process we discovered additional collisions that were missed in the creation of the collision maps and the counts are corrected in these but not the ones above because the additional counts did not materially alter the percentages.
We use squares of yellow for other visible injury, and red for serious or severe injury with the count of injury for that location contained within the square. This method provides additional visibility into the area of collision and the types of injuries sustained at that location. Some locations have a high collision count with a low injury count for that location. Other locations have higher injury counts than the collision number. This is due to the number of parties or people involved in the collision. For example, a tandem is 1 bike and 1 bike collision is counted if it collides with something. With two people on board sustaining visible or more serious injury, the collision count would be 1, and the injury count would show 2. With that explanation, here are the injury maps:
We suspect a high correlation of injury to collision might be indicative of infrastructure issues, or topography that merit a site survey at the location.
Types of Collisions
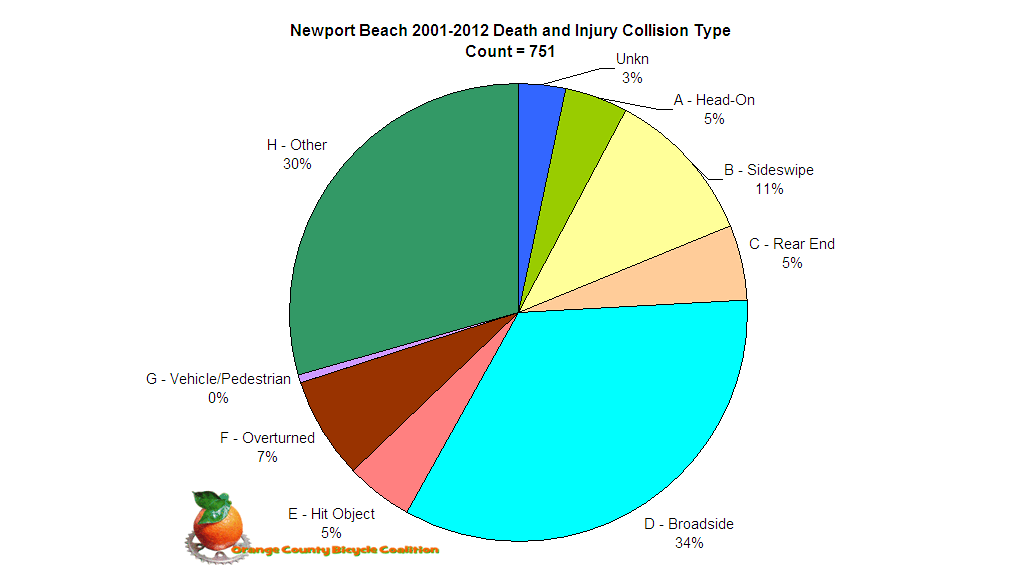
This chart shows the types of collisions not enjoyed by bike riders in Newport Beach:
It’s hard to imagine how 32% or almost one third of collisions are categorized by the of “unknown”, or “other” types of collisions. Maybe someone would care to explain how 70% proper recording of collision types is “good enough’. Did 32% of bike riders collide with the pavement of their own volition in solo collisions? While possible, we think it’s not probable, but then this is Newport home of the Dirty Diaper Dumper.
Time of Collisions
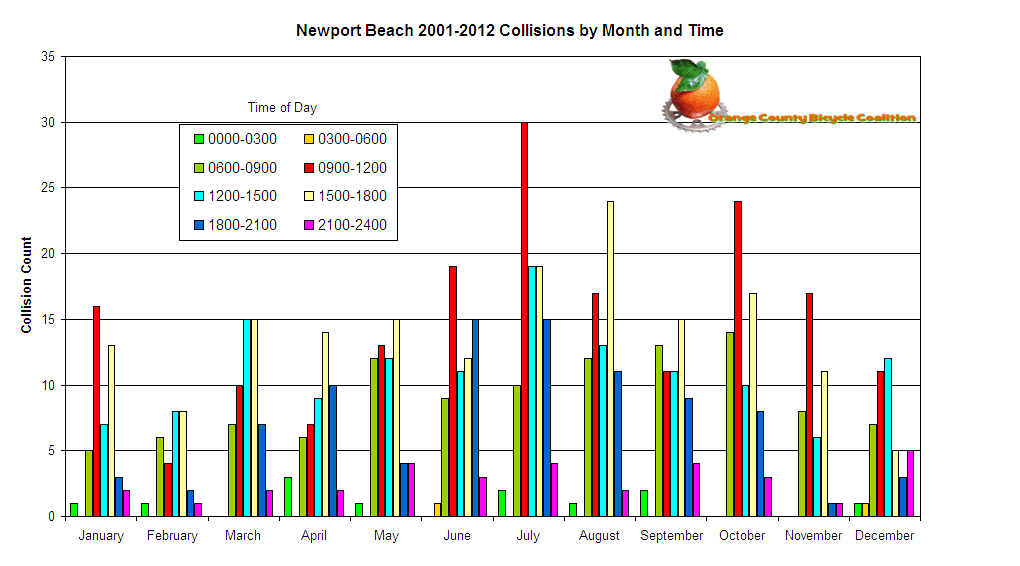
When are the most collisions likely to happen?
The above chart is a compilation of almost all the collisions in Newport Beach in 3 hour segments since 2001. All the collisions are not reflected in the chart because the times for over 25 collisions were either not recorded, or left blank.
Comments welcomed.

